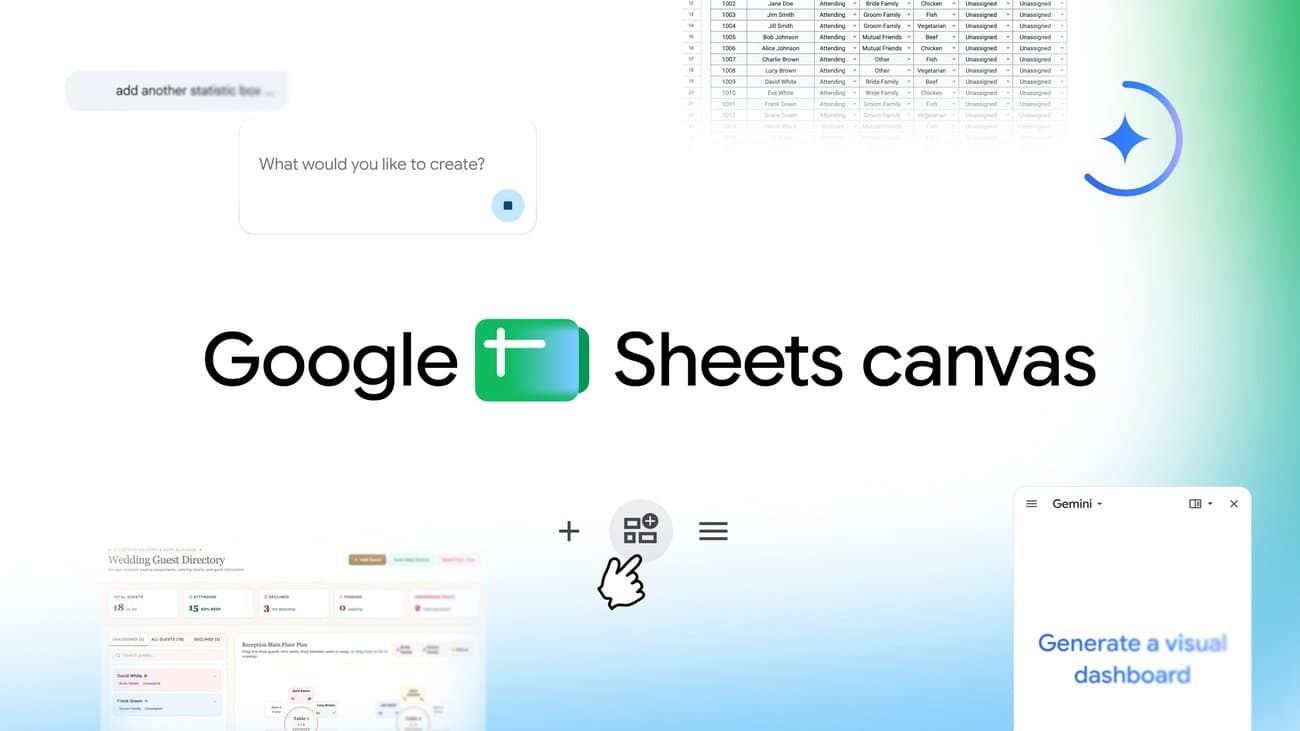
Bring your spreadsheet data to life with Sheets canvas
Google's new Sheets canvas feature transforms static spreadsheets into dynamic, interactive dashboards for enhanced data visualization.
Google has unveiled a groundbreaking feature called Sheets canvas, designed to revolutionize how users interact with spreadsheet data. This innovative tool allows users to convert traditional spreadsheets into interactive dashboards, making it easier to visualize and analyze data in real-time. By integrating various data visualization elements, Sheets canvas aims to streamline workflows and enhance decision-making processes for users across different sectors, from business analytics to educational settings.
The introduction of Sheets canvas reflects Google’s ongoing commitment to improving user experience and productivity within its suite of tools. Users can now create visually appealing dashboards that incorporate charts, graphs, and other interactive elements, all while leveraging the existing data in their spreadsheets. This feature not only simplifies the process of data visualization but also empowers users to present their findings in a more engaging manner, fostering better collaboration and communication among teams.
Key facts
| Field | Detail |
|---|---|
| Feature | Sheets canvas |
| Purpose | Transform spreadsheets into interactive dashboards |
| User Benefit | Enhanced data visualization and analysis |
| Integration | Works with existing Google Sheets data |
| Target Users | Businesses, educators, data analysts |
| Availability | Recently launched |
The launch of Sheets canvas comes at a time when data-driven decision-making is more critical than ever. Businesses and organizations are increasingly relying on data analytics to guide their strategies and operations. Prior to this, users often faced challenges in presenting complex data sets in a clear and understandable way. Traditional spreadsheet tools, while powerful, often fell short in providing the visual context necessary for effective data interpretation. With Sheets canvas, Google is addressing this gap by offering a solution that combines the analytical power of spreadsheets with the visual appeal of interactive dashboards.
Moreover, the rise of data visualization tools in the market, such as Tableau and Microsoft Power BI, has set a high standard for how data can be presented and interpreted. Google’s Sheets canvas positions itself as a competitive alternative, particularly for users already embedded within the Google ecosystem. By allowing seamless integration with Google Sheets, it eliminates the need for users to switch between different platforms, thereby enhancing productivity and user satisfaction.
Looking ahead, Google plans to expand the capabilities of Sheets canvas, potentially introducing more customization options and advanced features based on user feedback. As organizations continue to prioritize data literacy and visualization, the demand for tools that simplify these processes will only grow. The success of Sheets canvas may well depend on how effectively Google can iterate on this feature to meet the evolving needs of its users in an increasingly data-centric world.
Source: Google AI Blog · Read original →
Discussion
Comment here after signing in, or share the story to continue the conversation elsewhere.
Instagram & TikTok: copy the link and paste into a Story, Reel, or post caption.
Log in or create an account to comment — Google / GitHub / X when those providers are configured.
No comments yet — start the thread.
