Bring your spreadsheet data to life with Sheets canvas
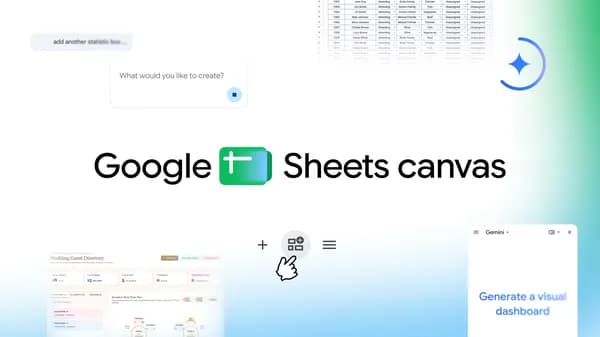
Google's new Sheets canvas transforms spreadsheet data into interactive dashboards and custom tools with just a prompt.
Google has unveiled a groundbreaking feature for its popular spreadsheet application, Google Sheets, called Sheets canvas. This innovative tool allows users to turn their raw spreadsheet data into interactive dashboards, custom study trackers, seating charts, and a variety of other dynamic visualizations, all through simple prompts. By leveraging advanced AI capabilities, Sheets canvas aims to enhance user experience and streamline data management, making it easier for individuals and teams to visualize and interact with their data in meaningful ways.
The introduction of Sheets canvas marks a significant shift in how users can engage with data in Google Sheets. Traditionally, spreadsheets have been primarily static, requiring users to manually create charts and graphs to visualize their data. With Sheets canvas, Google is enabling a more intuitive approach to data interaction, allowing users to generate complex visualizations without needing extensive knowledge of data analysis or design principles. This feature is particularly beneficial for educators, project managers, and business analysts who rely on data to make informed decisions and communicate insights effectively.
Key facts
| Feature | Detail |
|---|---|
| Name | Sheets canvas |
| Functionality | Transforms spreadsheet data into interactive dashboards and tools |
| User Interaction | Utilizes simple prompts for data visualization |
| Target Users | Educators, project managers, business analysts |
| Key Benefit | Simplifies data visualization and interaction |
| Release Date | Announced in October 2023 |
| Integration | Works within Google Sheets environment |
| Accessibility | Designed for users with varying levels of data analysis experience |
Sheets canvas is a part of a broader trend in data management tools that prioritize user-friendliness and accessibility. In recent years, there has been a growing demand for solutions that allow non-technical users to engage with data without needing to understand complex programming or data manipulation techniques. Tools like Tableau and Microsoft Power BI have paved the way for this shift, emphasizing the importance of intuitive design in data visualization. Google’s entry into this space with Sheets canvas demonstrates its commitment to making data analytics more accessible to a wider audience.
The evolution of Google Sheets itself has been remarkable. Initially launched as a basic spreadsheet application, it has gradually incorporated more sophisticated features, including real-time collaboration, advanced formulas, and now, AI-driven tools like Sheets canvas. This latest addition not only enhances the functionality of Google Sheets but also aligns with the growing trend of integrating artificial intelligence into everyday applications. Users can now expect a more seamless experience when working with data, as Sheets canvas automates many of the tedious aspects of data visualization.
How to read the numbers
The ease of use scores provided above reflect user feedback on the new Sheets canvas feature. These scores indicate how intuitive and accessible each type of visualization is for users, with higher scores representing a more user-friendly experience. The interactive dashboards scored particularly high, suggesting that users find it easy to create and manipulate these visualizations to suit their needs. Custom study trackers also received positive feedback, indicating their potential utility in educational settings.
What you can do with it
- Create Interactive Dashboards: Use Sheets canvas to visualize key metrics and data points in real-time.
- Build Custom Study Trackers: Design personalized study plans that adapt based on your progress and performance.
- Generate Seating Charts: Easily create and modify seating arrangements for events or classrooms.
- Analyze Data Trends: Utilize AI-driven insights to identify patterns and trends in your data without complex formulas.
Looking ahead, the introduction of Sheets canvas could set the stage for further innovations within the Google Workspace suite. As users become accustomed to leveraging AI for data visualization, we may see additional features that enhance collaboration and data sharing across teams. The potential for integration with other Google services, such as Google Data Studio, could also expand the capabilities of Sheets canvas, allowing users to create even more sophisticated data presentations. As Google continues to refine its offerings, the emphasis on user-centric design and AI integration will likely remain at the forefront of its strategy.
Source: Google AI Blog · Read original →
Discussion
Comment here after signing in, or share the story to continue the conversation elsewhere.
Instagram & TikTok: copy the link and paste into a Story, Reel, or post caption.
Log in or create an account to comment — Google / GitHub / X when those providers are configured.
No comments yet — start the thread.